Is Now the Right Time to Buy a House in the UK?

2026 has started with a bang for the UK property Market! House Prices rose in January at the fastest pace since 2020. Indeed February has been relatively flat but it is positive to see that January's inflated asking prices have still remained.
During December 2025 The Bank of England Base Rate was lowered to 3.75%. In turn mortgage rates have fallen and the average 5 year fixed rate now stands at 4.38%. The rate of inflation remains above the governments target of 2% and has fallen to 3.2%, this recent fall in the inflation rate is largely due to a fall in food price inflation. With higher costs for consumers at the shops and with bills this may negatively affect the affordability for those who are wishing to buy a home.
What Are the Current House Price Figures?
In the UK there are various different sources that analyse the market and produce average house price figures with differing results so here's a look at what each index has reported:
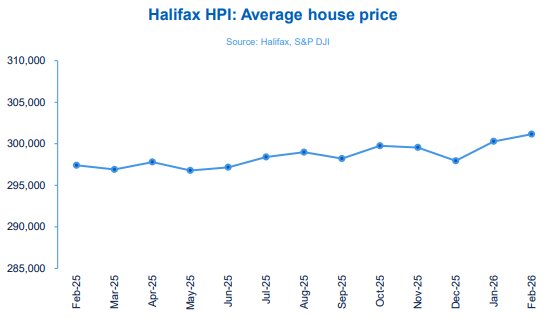
Halifax
The Halifax House Price Index reported in March and represents figures for February, shows a monthly increase of 0.3% and a year on year growth rate of 1.3% which it says is the strongest annual growth rate in the past 4 months. According to Halifax the average house price stands at £301,151, which is a new all time high.
Nationwide
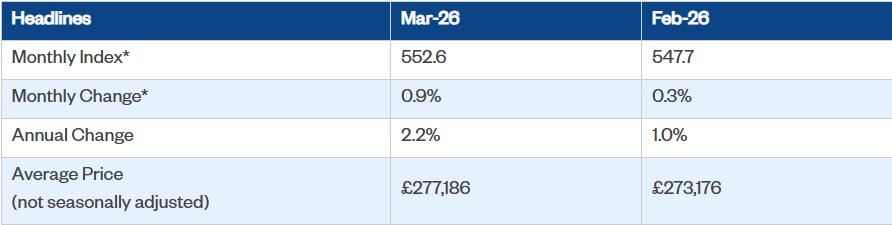
The Nationwide House Price index for March shows a 2.2% annual house price increase, which is up from the 1.0% annual house price increase that was reported in February. House prices fell in two out of the 13 UK regions with prices in the South East falling 0.7% and also falling 0.4% in East Anglia. Significantly House prices in Northern Ireland have increased 9.5% in the past year which Nationwide have said "This was more than six times faster than the 1.5% recorded in the UK as a whole (in Q1)". For England the North West is the region that has shown the fastest growth at 3.3%. There are of course concerns that future reports won't show as much growth due to higher inflation and the uncertainty of the Iran War. The report for March shows that the national house price is currently £273,176.
Zoopla
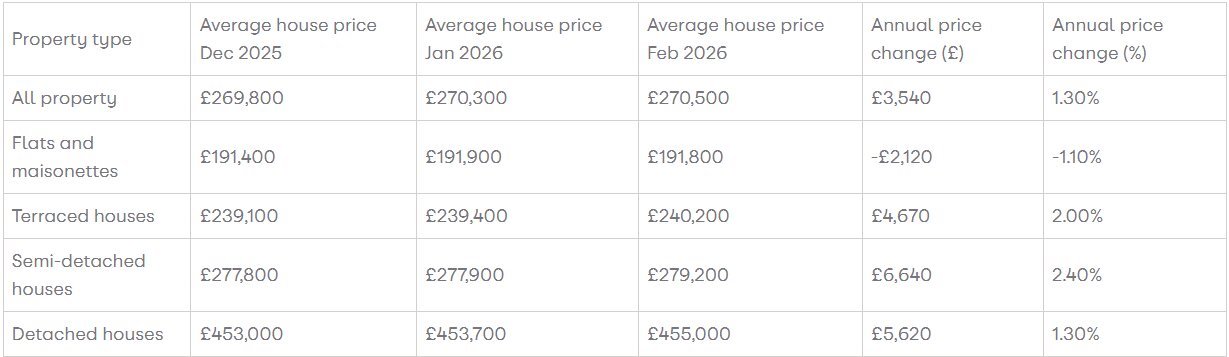
Similar to Rightmove, Zoopla record advertised "For Sale" prices so they are always more optimistic than Land Registry results and prices that are reported by mortgage lenders. Zoopla are reporting that house prices have risen 1.3% over the past year. Even though prices have risen there is 2% less buyer demand and Zoopla give caution to the fact that interest rates and in turn mortgage rates may rise in the forthcoming months due to the uncertainty of the world economic situation. Sales are currently being supported by committed "serious buyers" as Zoopla call them, who are intent on moving regardless of the world economic outlook. According to Zoopla the National House Price currently stands at £270,500.
Rightmove
House Prices on Rightmove are based on asking prices and the UK average now stands at £371,042. March's figures show a increase of £3,023 which is 0.8% higher than the previous month. Rightmove say that it is too early to say what effect the Iran war will have on the property market but from looking at their own portal they say that they have not seen a significant sharp change in activity when compared to previous similar events. The full report for March can be seen here.
Office of National Statistics
The Office of National Statistics now reports data in a report that is called Private Rent and House Prices. The data for July shows that over the past year the national house price has increased 3.9% for figures recorded up to May and stands at £269,000. These figures are delayed by a couple of months as they are based on completed prices.
Should You Buy a House in 2026 or Wait?
The positive start to year as lead commentators such a Colleen Babcock of Rightmove to say "2026 is shaping up to be a good year to buy". After experiences a very flat property market with house prices increasing by just 1.5 in the past 3 years, there are good indications that we may be turning a corner and going into an uptrend of house price increases.
Reasons why House Prices May Rise This Year
- January got off to the best start since 2020.
- Average wages have increased by 17% over the past 3 years meaning property is now more affordable and more people will be able to borrow more
- We have experienced a high rate of inflation over the past few years, the value of the pound is now worth less and house prices should eventually rise to reflect this.
- Mortgage rates are lower than last year. For example the average 2 year fixed mortgage is now 4.28% compared to 4.96% this time last year.
There is currently the most available stock that we have seen in a decade and buyers have plenty of choice. With there being far more properties for sale than available buyers, purchasers could take advantage of it being a buyers market.
There is a risk that house prices could fall further and maybe even take a tumble with a domino effect of sellers having to reduce their asking price multiple times. With this in mind house prices have reduced since their all time highs so as a buyer you will not be buying at the top of the market. It could be a good opportunity to grab a bargain from a seller who may have been trying to sell their home for quite a while, particularly for properties at the higher end of the market as we have seen that the higher priced properties have been taking far longer to sell. House buyers will likely see a lot of asking prices that have been recently reduced and buyers could find themselves in a good position to further ask for a reduction in the sale price.
Here are some of the predictions of how far house prices could rise or fall during 2025:
2025 House Price Predictions
| Source | Prediction |
|---|---|
| Zoopla | 1% |
| Halifax | 0% – 3% |
| Savills | 3.5% |
| Knight Frank | 2.5% |
| Lloyds Bank | 0% – 3% |
| Rightmove | 2% |
If you need to sell your property quickly in the current market, contact Direct House Buyer for a free, no-obligation cash offer.